The AIGraphing Calculatorthat thinks with you.
From questions to graphs, instantly.
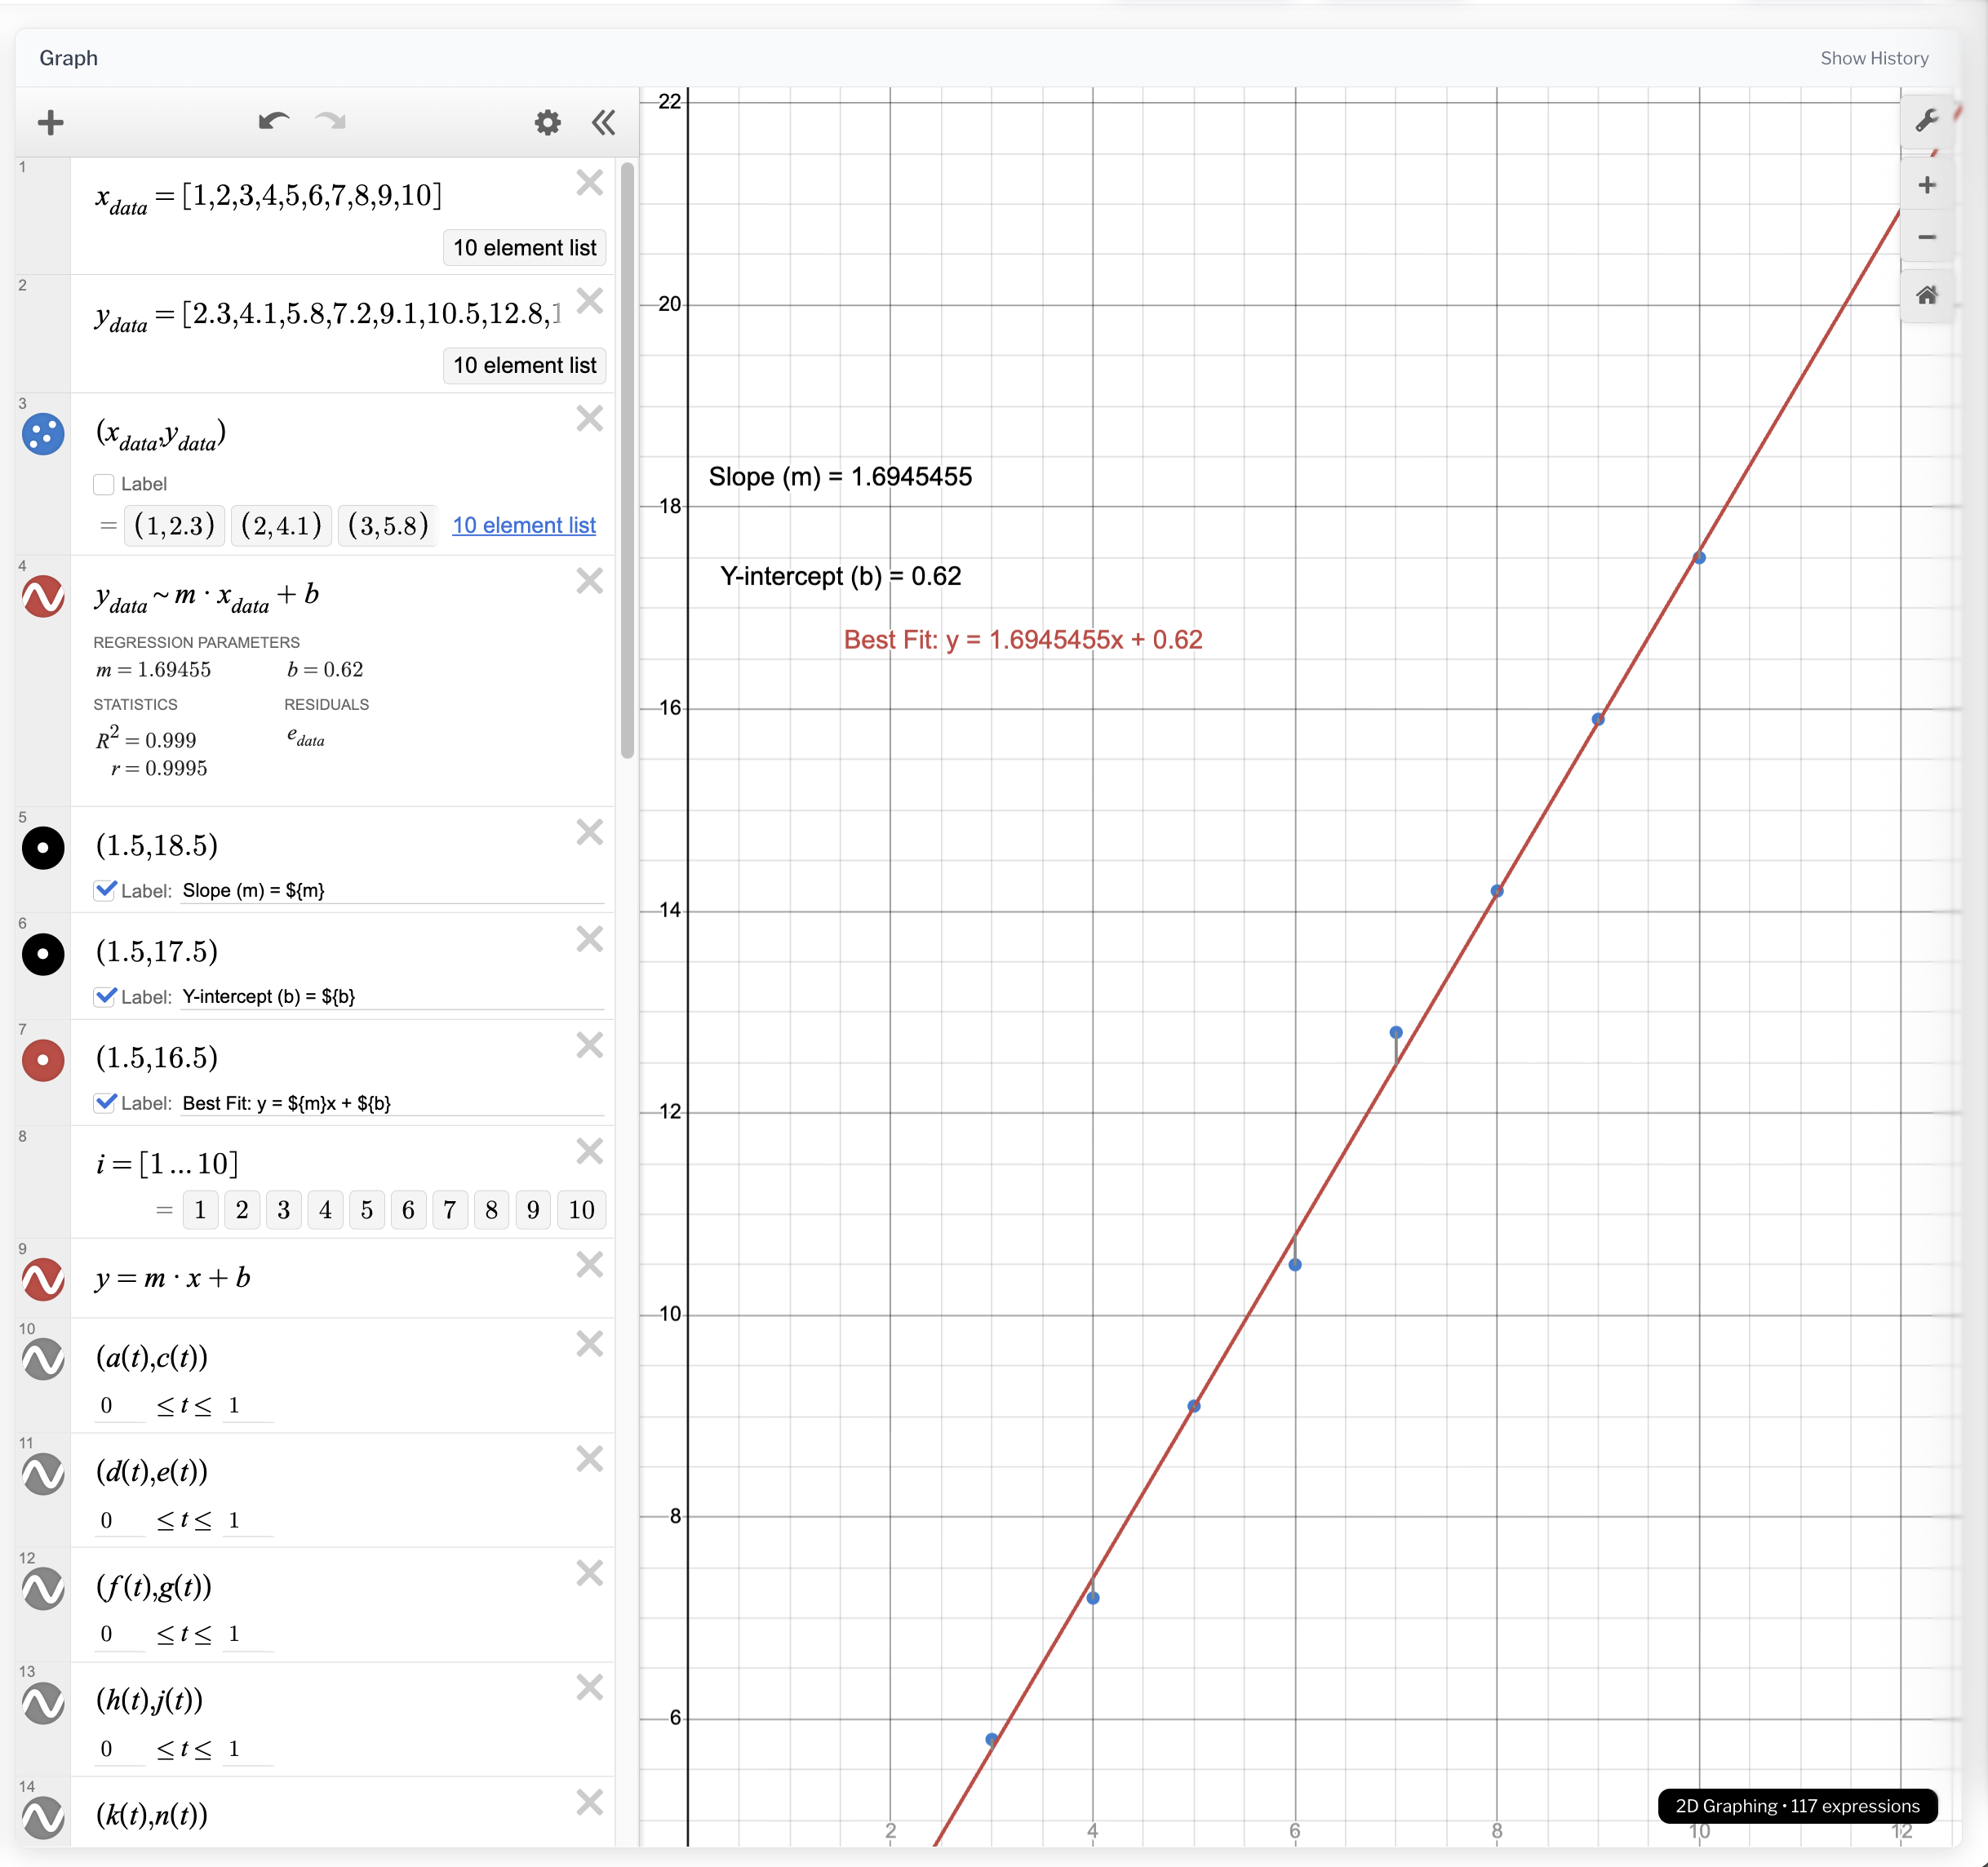
Try moving the orange dot ●
Bring any idea, concept or problem to life.
Full flexibility, no holding back.
What's Possible
Interactive visualizations built with Soroban Labs.
A new way to learn math.
Introducing Tutor mode in Soroban Labs.🐈
Fluffy the tutor watches you do math and asks you questions.
Here, Fluffy is teaching you the Pythagoras Theorem.
From prompts to visualizations, in seconds
Prompt
“Visualize the Pythagorean theorem. Draw a right triangle with sides a, b, c. Show squares on each side with areas labeled. Add sliders for a and b so the user can see a² + b² = c² dynamically.”
Interact with the sliders
Pick components to customize
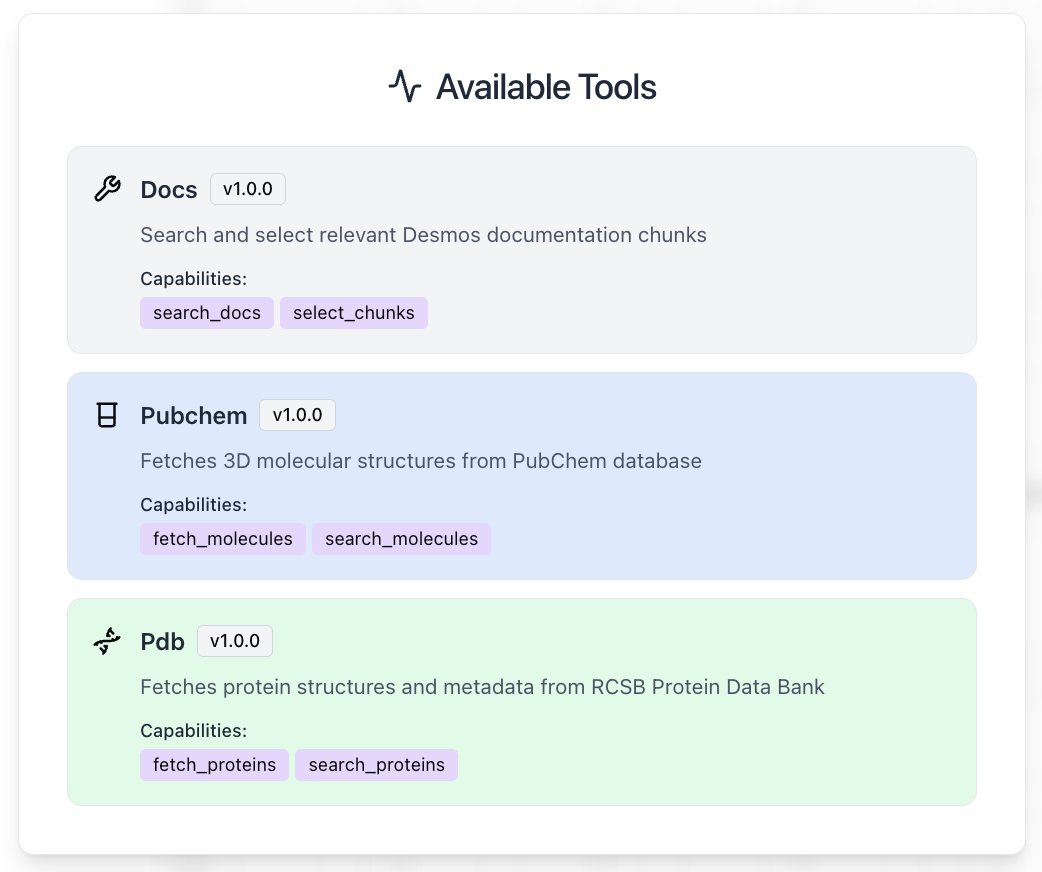
Built-in tools for accurate graphs
Simple, Transparent Pricing
Soroban Labs is currently in beta and free for individuals.
For institutions, we'd love to run a pilot program with you — completely free.
Institutions
Let's chat
- Everything in Academics
- API access
- Dedicated support
- Include Soroban Labs in your product
Questions? Reach out at hello@sorobanlabs.io
Glucose molecule. Try moving it around!